OPC UA & Wireshark
UPDATED: 2021-05-10 to reflect the current Wireshark version. Also added details of filtering.
Wireshark is a great tool for sniffing network traffic. It contains several predefined filters for various protocols – and yes, also for OPC UA!
It can be a valuable tool, if you need to investigate what traffic is going between an UA client and server by revealing the contents of every packet – unless of course, you have enabled encryption on the connection!
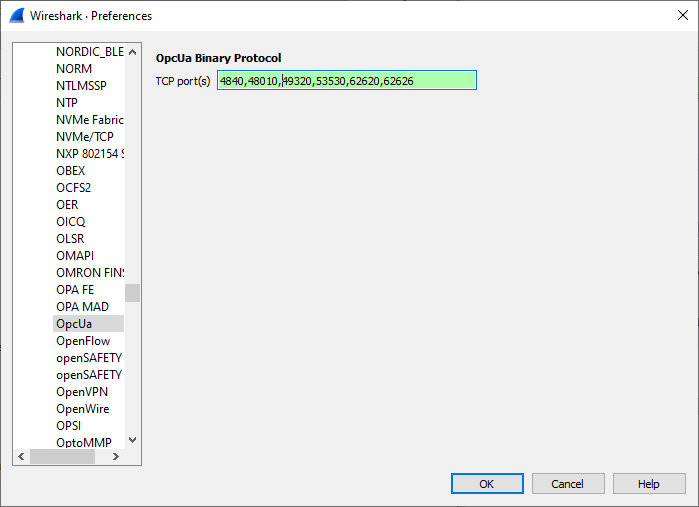
There is one important setting that you need to take care of. Once you have started it for the first time, go to Edit-Preferences-Protocols-OpcUa. You must define the port numbers that may contain UA traffic in order to make the opcua protocol filter to work.

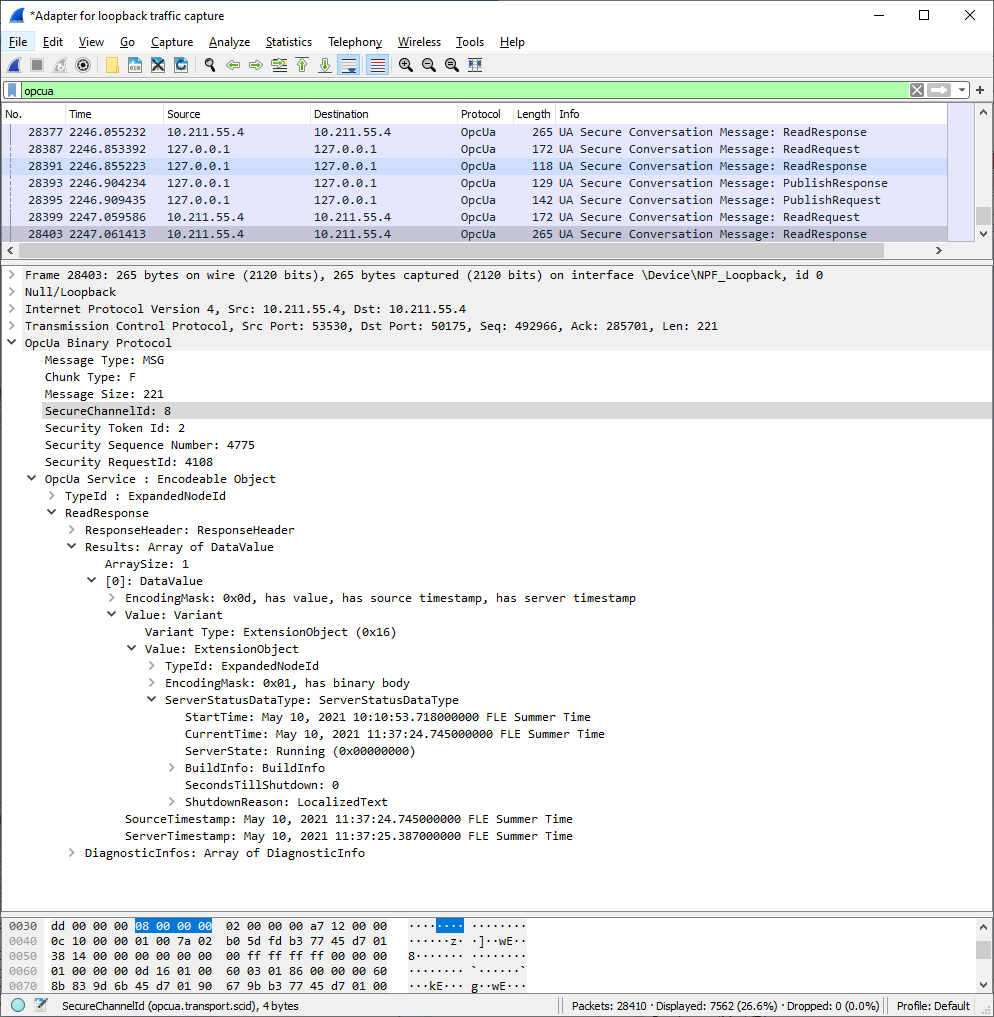
You can then just start capturing packets. If you filter with “opcua”, you will only get OPC UA packets.

As you can see, it can parse the UA packets down to every parameter for display in the log!
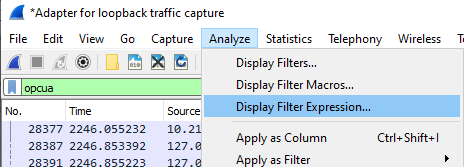
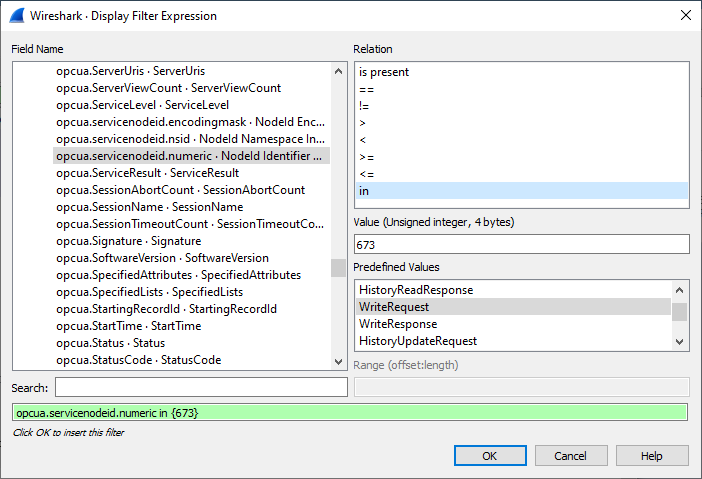
You can further filter by the port number, etc. Use the Expression editor to build your own filter. This is useful, since the log gets easily filled with Read messages, due to the clients typically monitoring the connection and ServerStatus with frequent calls.

If you wish to filter WriteRequests, you can find that from the available service list.

We found out that the ServiceNodeId is 673 for the WriteRequest. Once I have created that, I added 676 to the ‘in’ filter, after which we can also see the WriteResponses:

Also, check out the details about the filter syntax and the reference of the OPC UA filter.
More Information
If you have any questions or comments; please don’t hesitate to contact us by email at sales@prosysopc.com or through our website contact form.
Author Info

Jouni Aro
Chief Technology Officer
Email: jouni.aro@prosysopc.com
