Introducing Prosys OPC UA Forge Grafana Plugin
We’re pleased to present our Forge Grafana Plugin, a free tool that brings OT data from Forge into IT dashboards via Grafana. It allows you to visualize real-time and historical OT data from Prosys OPC UA Forge directly in Grafana, the popular open-source dashboard platform.
Whether you’re already working with Forge or just exploring your options, the plugin offers a straightforward way to create visual dashboards for your OT data. You can read more on our Forge product page, and request a free evaluation through our evaluation request form.
Why We Built It
An increasing number of users are integrating OT systems with IT monitoring tools. Grafana has become a preferred platform for dashboards thanks to its flexibility and widespread use in IT environments. At the same time, Forge has become a vital tool for managing OT data flows.
The idea for the plugin originated from a real-world need. Casa Mendes Gonçalves, a Portuguese food manufacturer, wanted to connect their OT data in Forge to Grafana dashboards. Their request echoed what we were already hearing from other users: the need for a simple, direct way to visualize OT data in Grafana. That insight became a feature—and now it’s available to everyone using Forge with OPC UA over REST Module.
You can read more about their setup in our case study about Casa Mendes Gonçalves.
What You Can Do With Forge Grafana Plugin
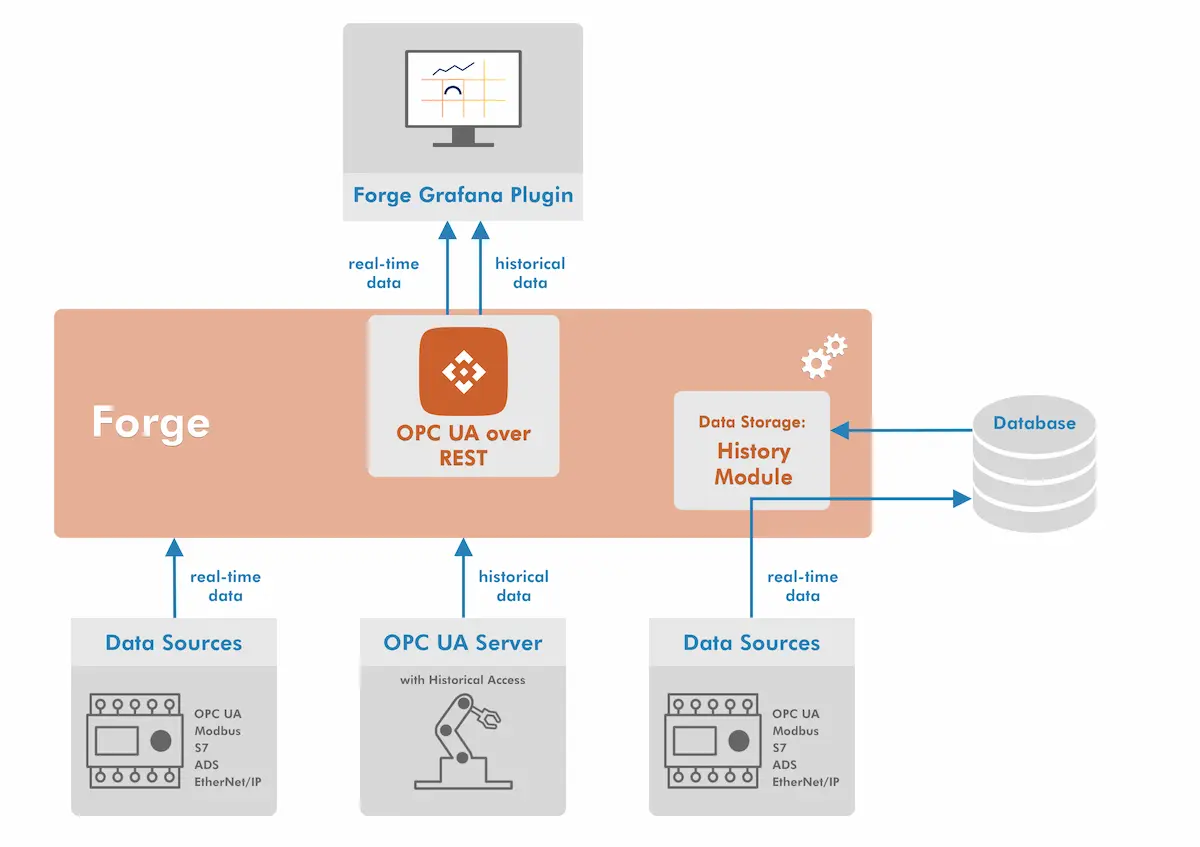
Forge Grafana Plugin lets you connect Forge to Grafana as a Data Source in just a few simple steps. As shown in the diagram below, the plugin connects to Grafana through Forge’s REST API. This allows you to query both real-time and historical OT data directly into your Grafana dashboards. There’s no need to set up additional databases or handle MQTT payloads. As of version 1.3.0 (21.01.2026), the plugin supports browsing Forge’s address space and OPC UA aggregate functions (Average, Minimum, Maximum, Range, Count, Start, End).
Because the plugin leverages Forge’s built-in functionality, there’s no need to write custom connectors or work directly with OPC UA protocol details. The result: a quick and streamlined way to turn your OT data into actionable visuals.

Key Use Cases
Real-Time Monitoring
Visualize live data from devices and systems for immediate insights or troubleshooting.Devices Without Local Storage
Use Forge with the Data Storage Suite to store incoming data, and let Grafana visualize the historical data directly through Forge.OPC UA Servers with Historical Access
Use Forge as a gateway to deliver historical data to Grafana via REST.
In all scenarios, the plugin simplifies your data flow by removing extra layers and letting you focus on building the visuals that matter the most.
How to Get Started
To use Forge Grafana Plugin, you’ll need:
Prosys OPC UA Forge with OPC UA over REST Module, included with HTTP Connectivity Suite.
(Optional) Data Storage Suite for permanent and managed historical data
A running Grafana instance OR Docker environment
Installation Options
You can install the plugin in one of two ways:
Docker Image
A ready-to-use Grafana instance with the plugin pre-installed.ZIP Package
For manual installation into an existing Grafana setup.
Creating Dashboards With Forge and Grafana
Forge Grafana Plugin gives you fast, no-code access to meaningful OT insights. With just a few clicks, you can connect your data from Forge to visual components in Grafana. No scripting or custom connectors required.
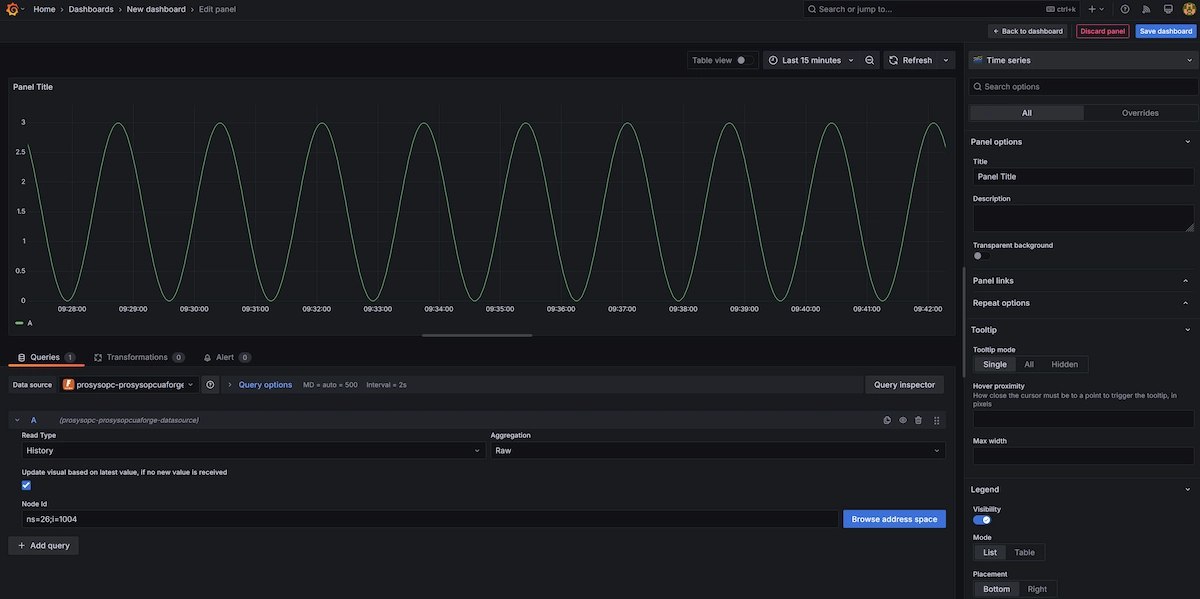
As you can see from the image below, the plugin offers a simple user interface where you can define which data to read from Forge, and how it should be displayed in your dashboards.

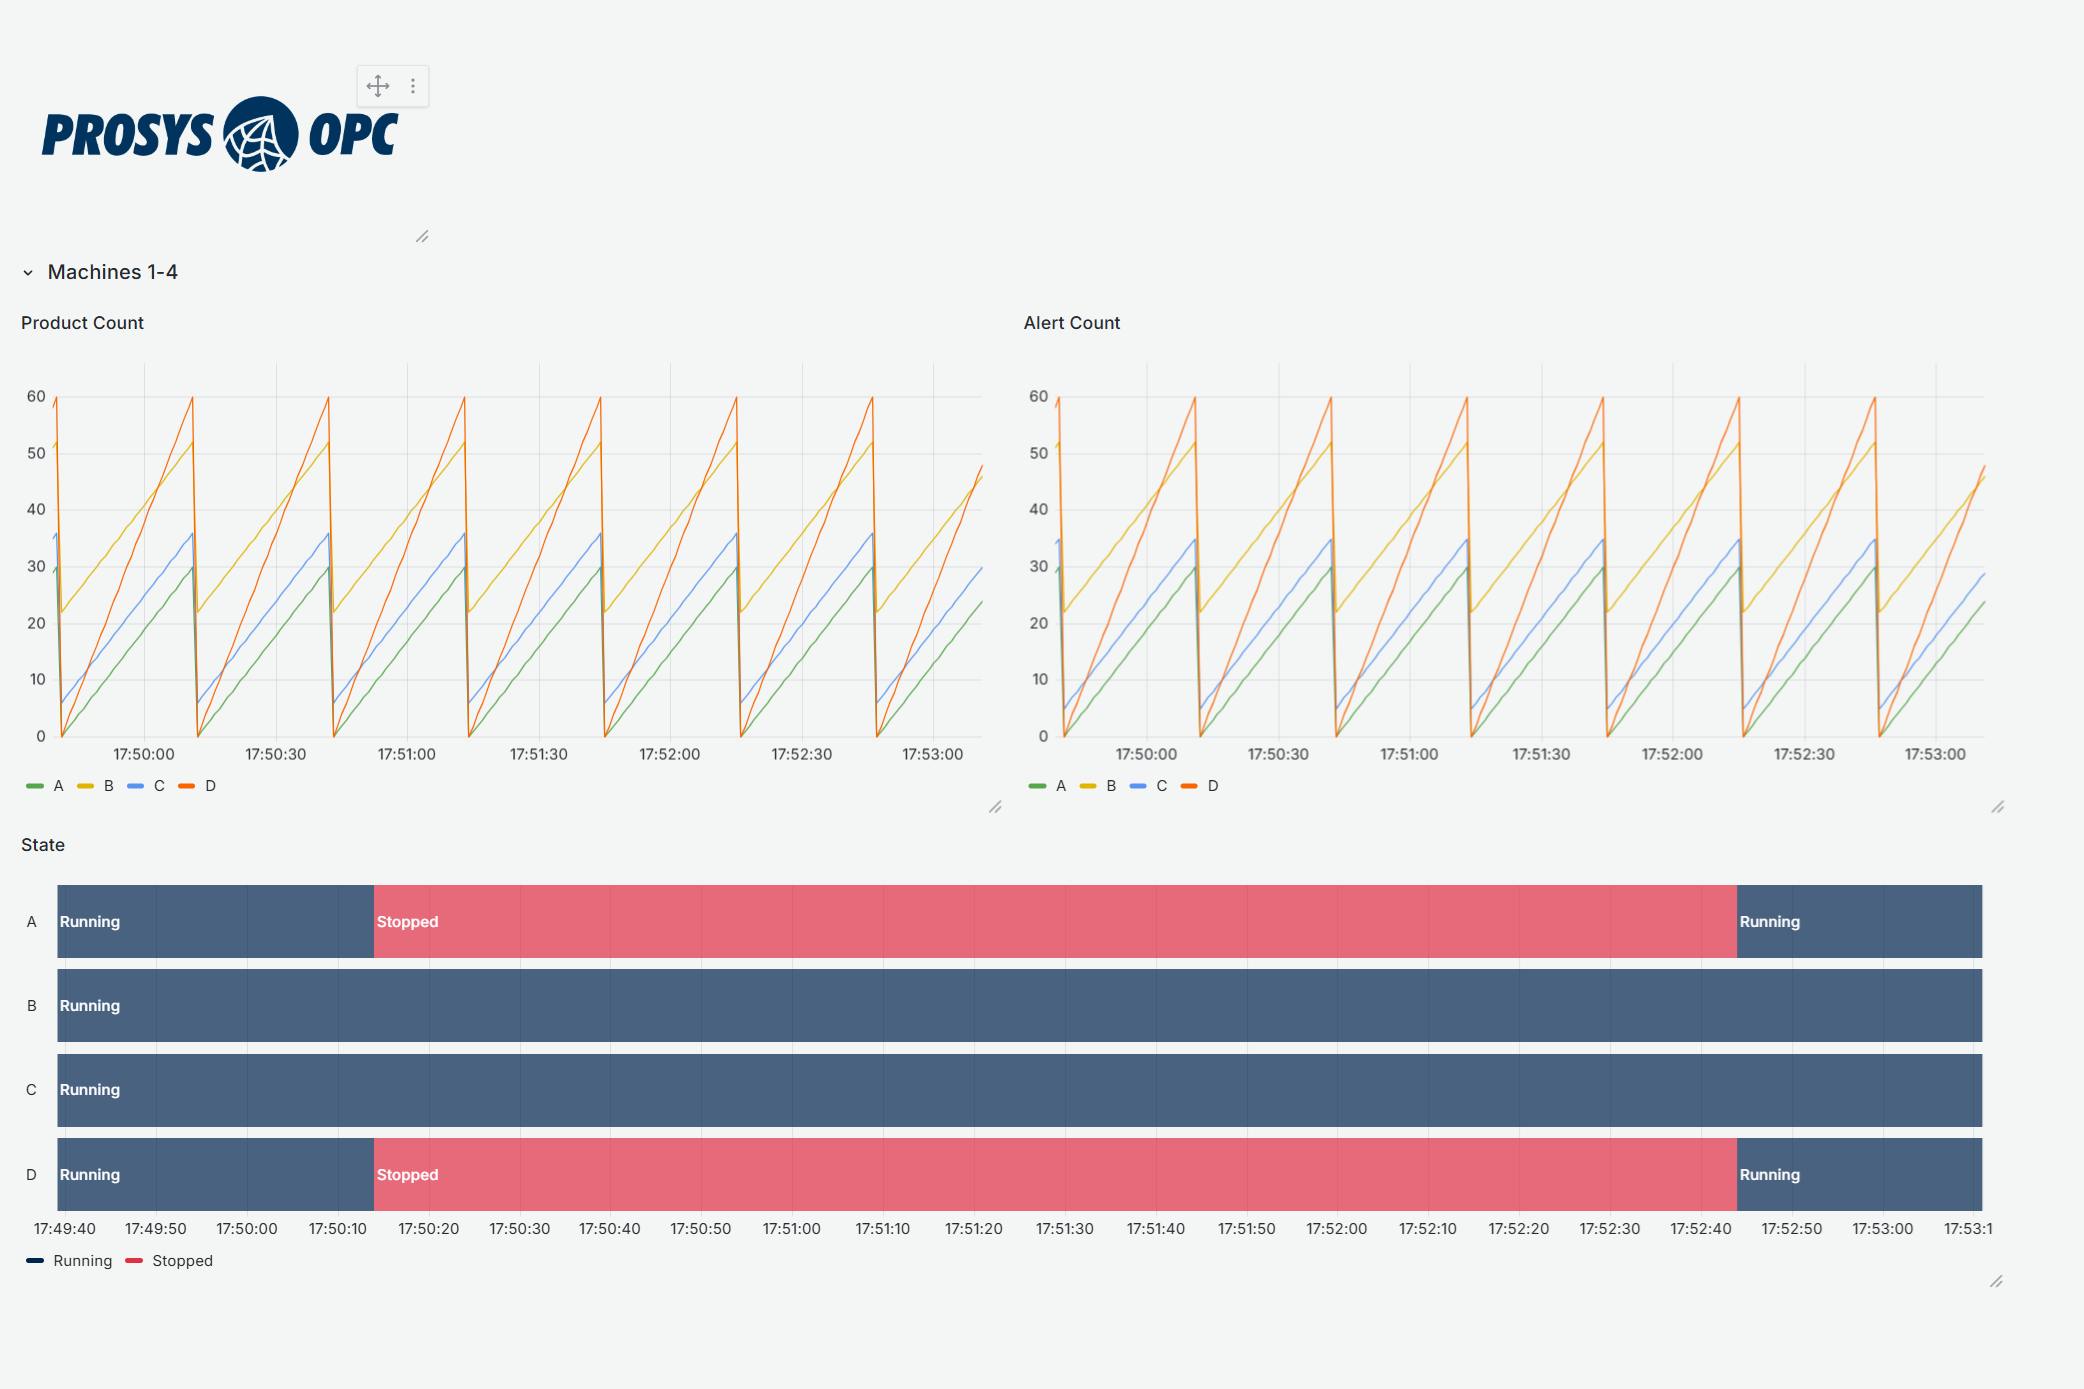
Forge offers unique capabilities to connect to OT data sources, and makes a solid match with Grafana. Whether you’re debugging device behavior or tracking long-term trends, Grafana dashboards powered by Forge help you stay on top of your data. Below, you can see our simple example dashboard.

Ready to try it out?
Start visualizing your OT data in Grafana with just a few clicks. Whether you’re monitoring live systems or digging into historical trends, Forge Grafana Plugin is free to use and easy to set up.
Check out our showcase!
See our showcase on how we use OPC UA Forge and the Grafana plugin to monitor air-condition data.
New to Forge?
Request a free Forge evaluation, and we’ll help you get set up with everything you need.
Already using Forge?
Contact us to get the plugin files along with setup instructions for your preferred installation method: either a ready-to-run Docker image or a ZIP package. Once you’ve got everything in place, check out our step-by-step Grafana Plugin tutorial to go from installation to insights in minutes.
Author Info

Iivo Yrjölä
Customer Integration & Support, Prosys OPC
Email: iivo.yrjola@prosysopc.com
