In this tutorial, we’ll walk you through how to use Prosys OPC UA Forge Grafana Plugin to integrate Forge with Grafana. If you’re looking for general information about the plugin and its features, you can find it on our Grafana plugin introduction post.
Prefer a video walkthrough? Watch our step-by-step YouTube tutorial on connecting Grafana to Forge.
This setup allows you to quickly create dashboards and visualizations using data from Forge. The plugin supports real-time and historical OT data. Historical data can come either from external OPC UA servers or from Forge’s History module (covered in Mastering Forge #6).
The plugin uses Forge’s REST API for direct connectivity and can be configured in just a few minutes. No custom connectors or scripting needed.
What You’ll Need
During this tutorial, we’ll be using the following products:
- Prosys OPC UA Forge
- You can download an evaluation version through the request form
- Prosys OPC UA Simulation Server
- You can download the free version through the product’s request form.
- Docker Desktop (for Docker Image installation)
- Pre-install Docker Desktop by following the Docker Desktop guide.
- Grafana Instance (for ZIP Package installation)
- Pre-install Grafana by following the Grafana installation Guide.
Select the installation method you would like to use below.
- Docker Image
- ZIP Package
Use Grafana Image with Forge Plugin
In this section, we’ll walk through installing Grafana pre-packaged with the Forge plugin using a Docker image. Make sure you have a working Docker environment on your system before proceeding.
To install Grafana with the Forge plugin, follow these steps:
1. Open a terminal or Command Prompt and pull the Docker image with Grafana and the Forge plugin pre-installed:docker pull prosysopc/grafana-forge 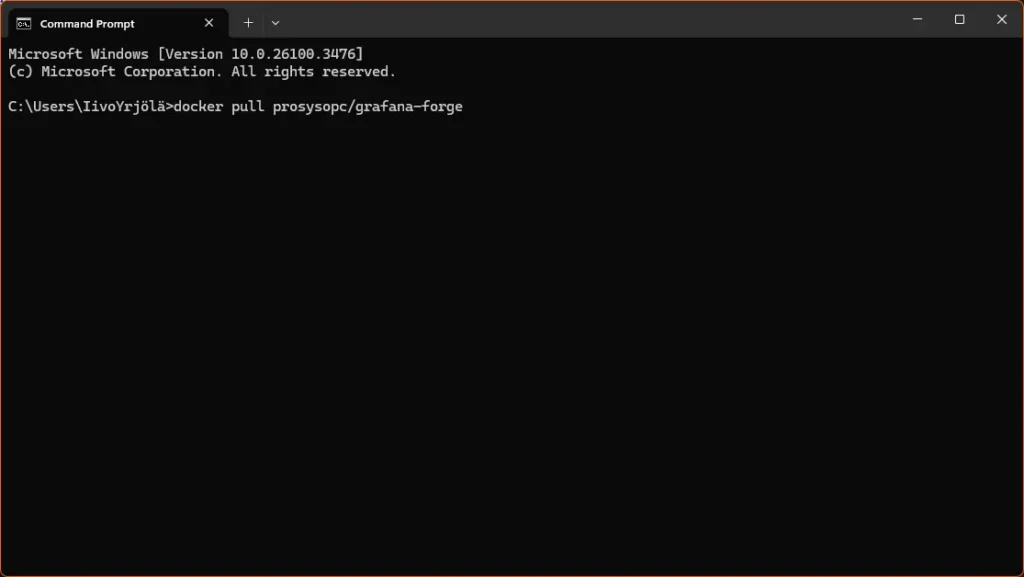
2. Start the container using the following command:
docker run -d -p 3000:3000 --add-host host.docker.internal:host-gateway --name grafana-forge prosysopc/grafana-forge
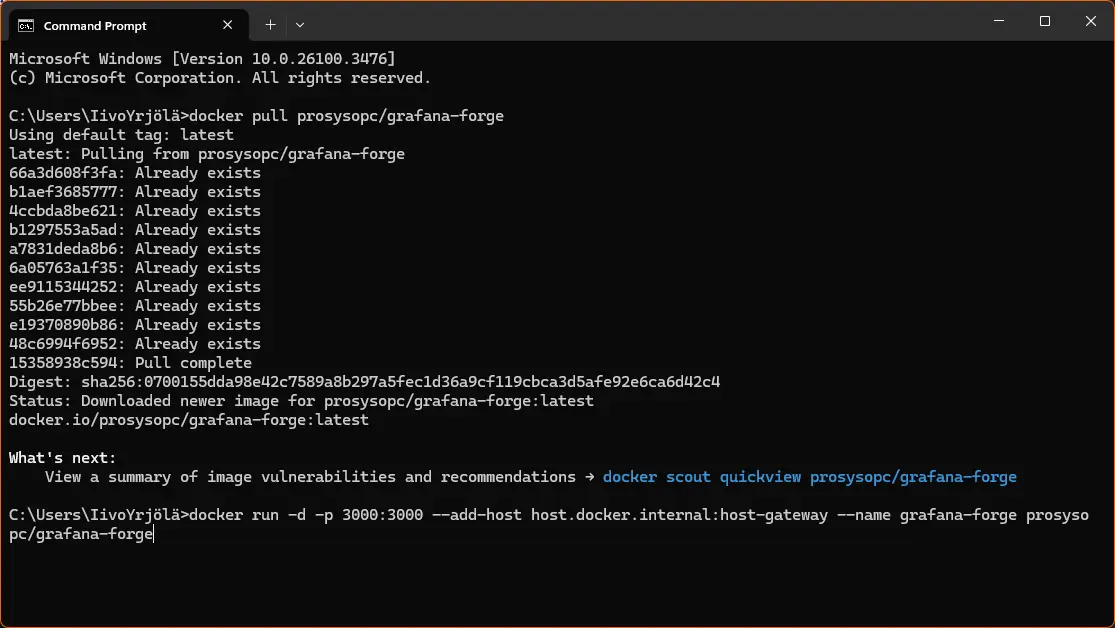
Note:
- The
--add-host host.docker.internal:host-gatewayflag allows Grafana to communicate with Forge running on the same host machine.
- The
- On Linux, use
docker run -d --net=host --name grafana-forge prosysopc/grafana-forge
- For more details, refer to Grafana’s official Docker deployment documentation.
Install the Forge Plugin on an Existing Grafana Instance
In this section, we’ll walk through how to manually install the Forge plugin into an existing Grafana setup.
Prerequisite:
This guide assumes you already have a running Grafana instance.
Follow these steps to install the Forge plugin:
Download the plugin ZIP file (contact us to receive access).
Extract the ZIP file into Grafana’s plugins directory.
Create a folder named prosys-opc-ua-forge-grafana-plugin under C:\Program Files\GrafanaLabs\grafana\data\plugins\, and extract the zip file into the created folder.
To confirm or locate your custom plugins directory, check the Grafana configuration:
Grafana Plugin Directory Configuration.
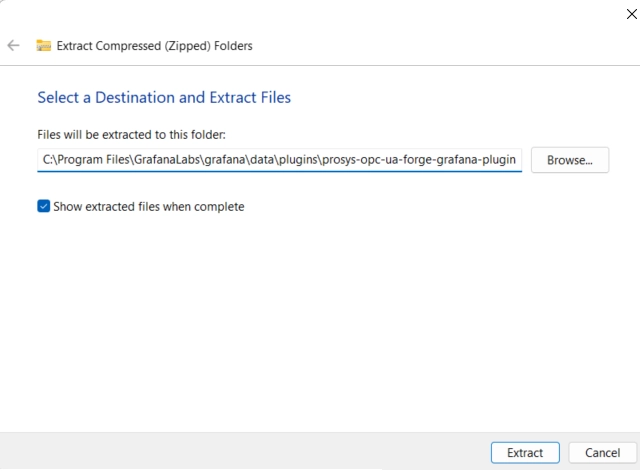
3. Update the Grafana config file (C:\Program Files\GrafanaLabs\grafana\conf\defaults.ini) to allow unsigned plugins. Open a text editor with administrator privileges and edit the following parameter line like below:
allow_loading_unsigned_plugins = prosysopc-prosysopcuaforge-datasource
- For detailed instructions, refer to Grafana’s documentation:
Allow Loading Unsigned Plugins.
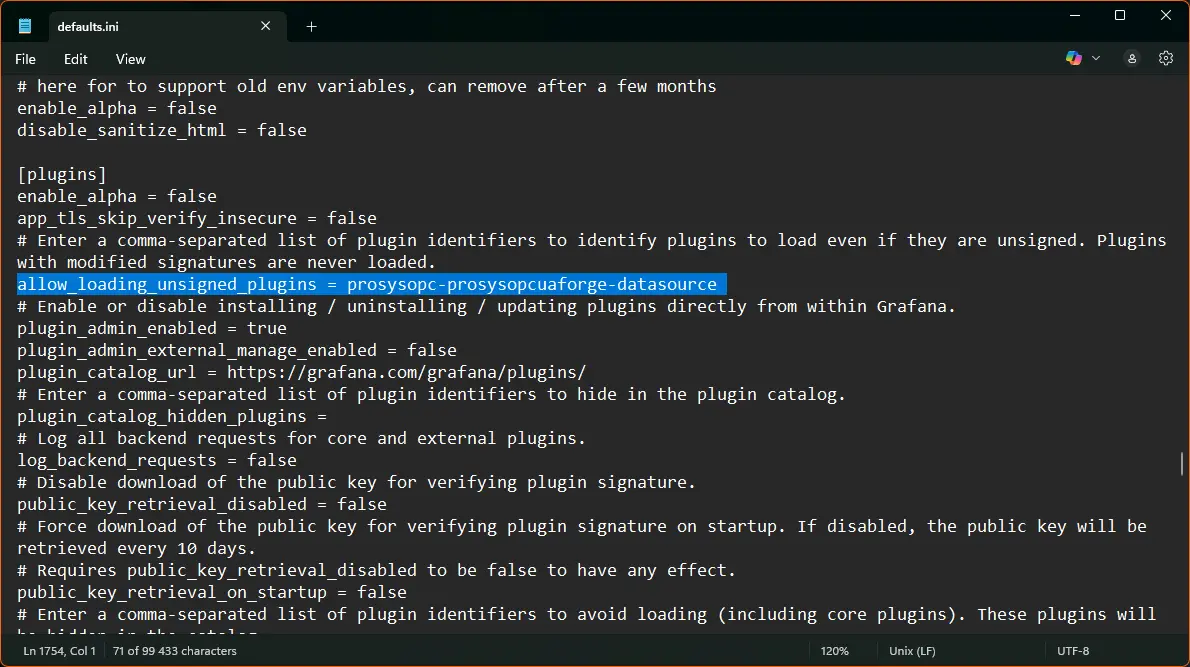
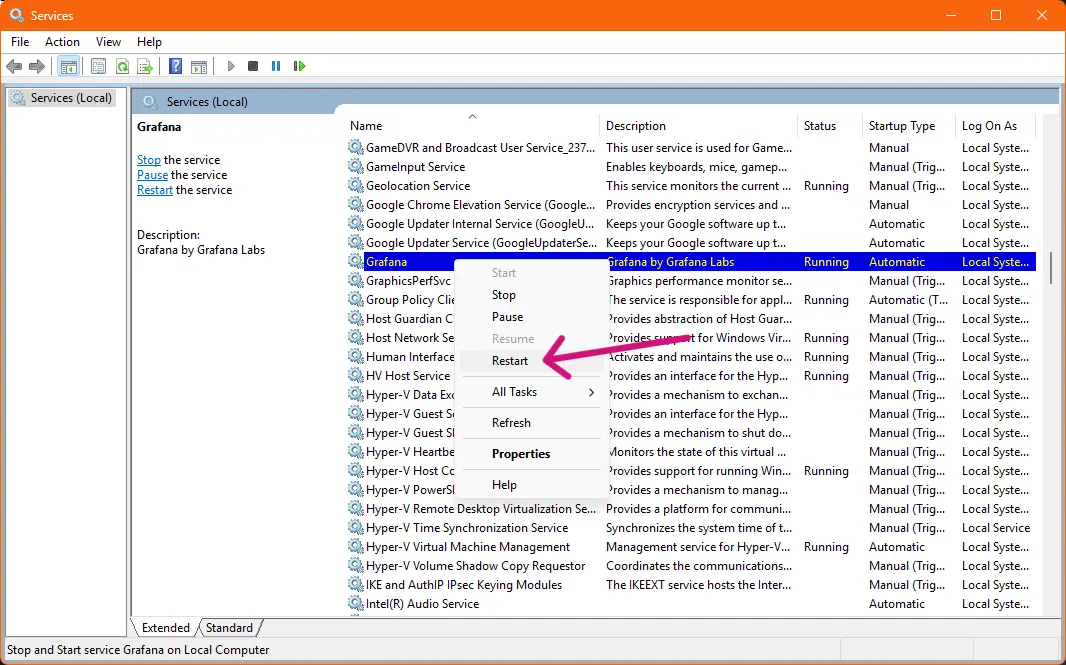
4. Restart the Grafana service via the Services app by right-clicking Grafana and selecting Restart.
Configure and Use the Forge Plugin
Now that the plugin is installed, you’ll configure it to connect to your Forge instance and begin using it to query and visualize Forge data within Grafana.
1. Open your browser and navigate to http://localhost:3000 to access the Grafana UI.
The default login credentials are:
Username: admin
Password: admin
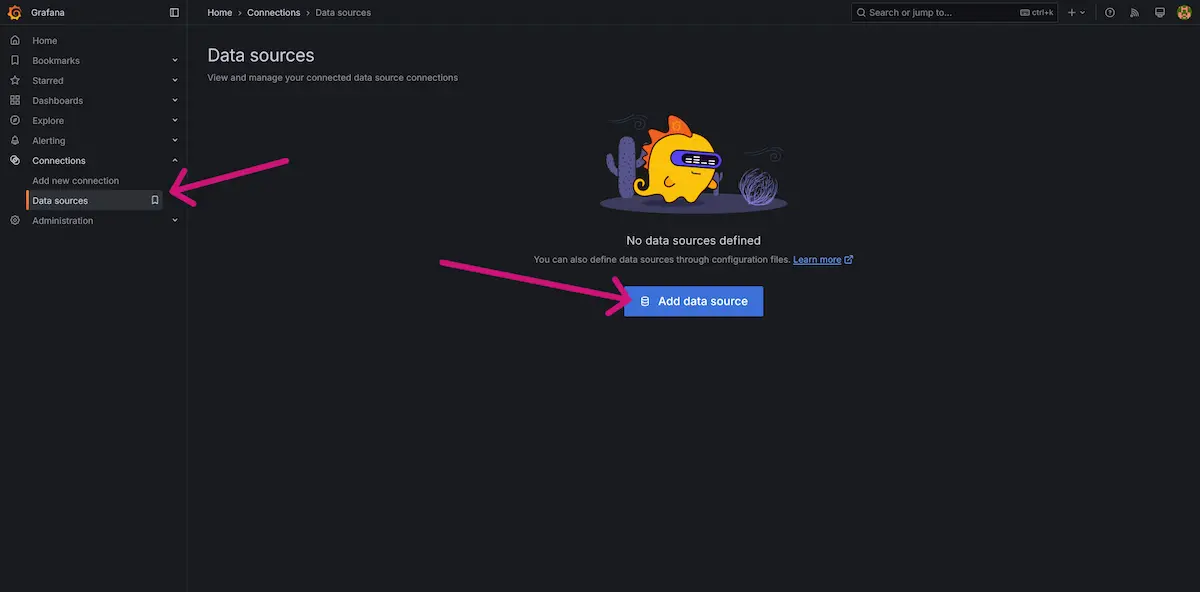
2. To add Forge as a data source, navigate to Connections > Data sources and click on Add data source.
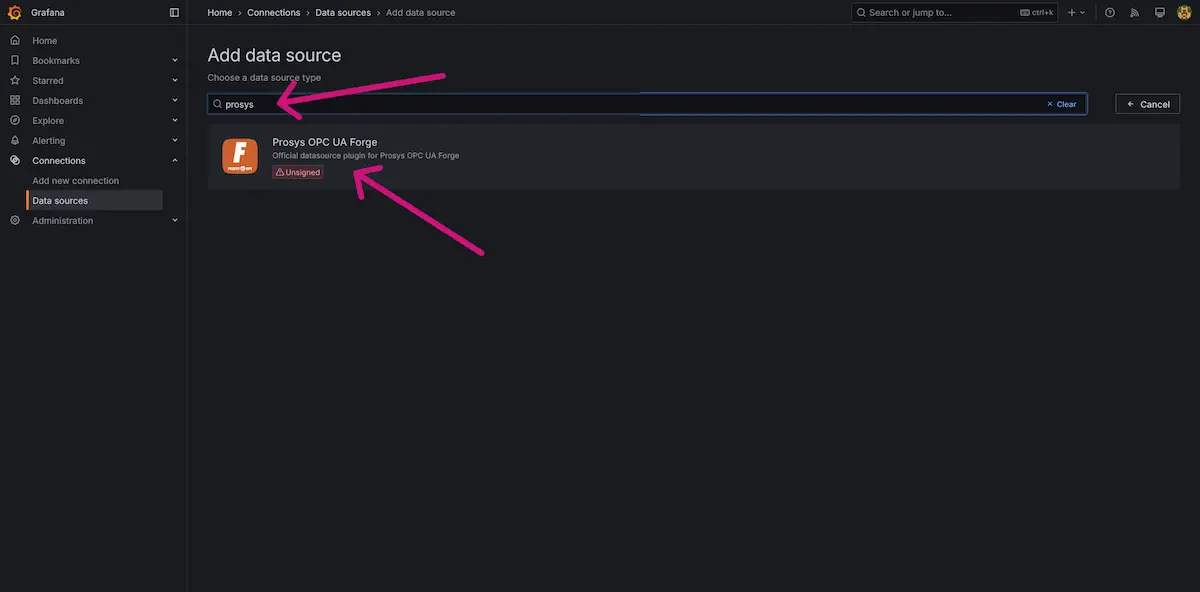
3. In the search bar, type prosysopc-prosysopcuaforge-datasource and select it from the list.
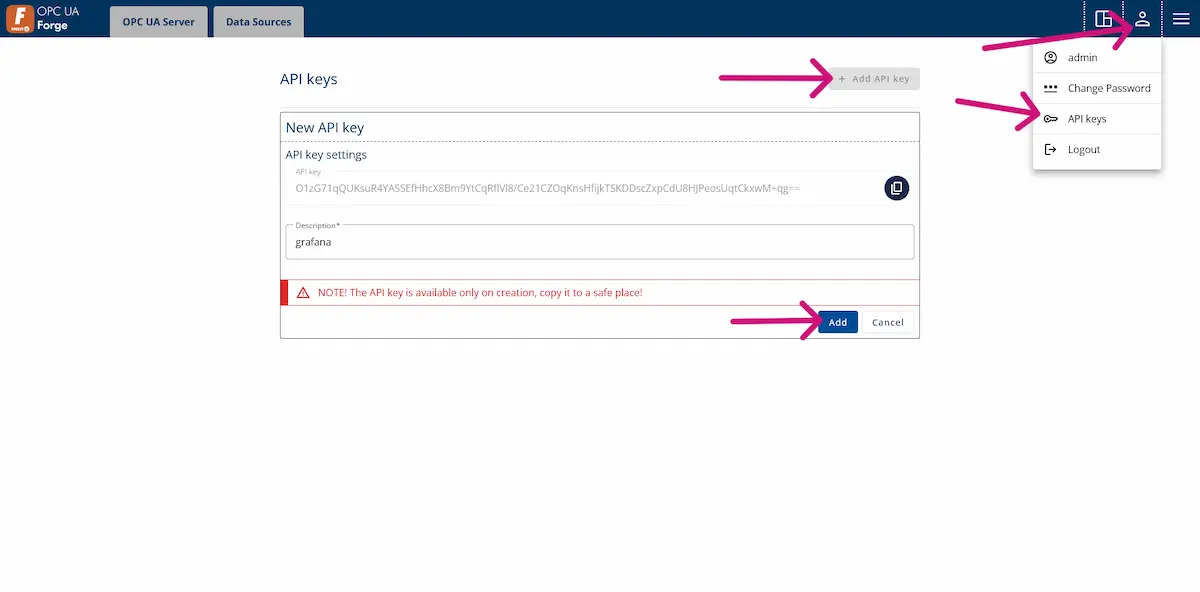
4. Log in to your Forge and generate an API key. This key will be used by the plugin to authenticate with Forge.
5. In the data source configuration screen, enter the URL of your Forge instance (e.g., http://localhost:8080) and paste the API key you just created.
- If you are running Forge container on the same machine, use http://host.docker.internal:8080
6. Click Save & test to validate the connection between Grafana and Forge.
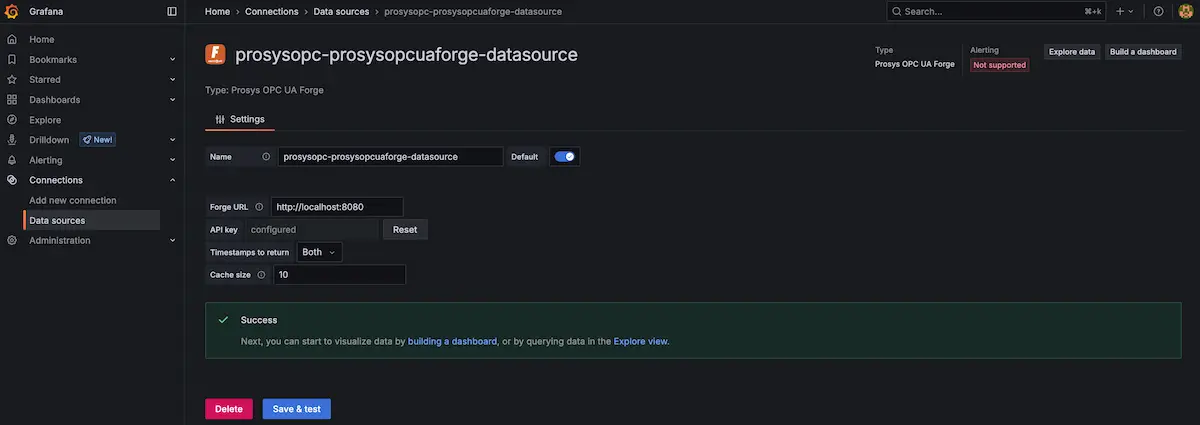
7. Once the connection is successful, you can start creating queries and building dashboards using data from Forge.
8. The query editor requires the NodeId of the OPC UA node you want to visualize in Grafana. You can copy this directly from Forge.
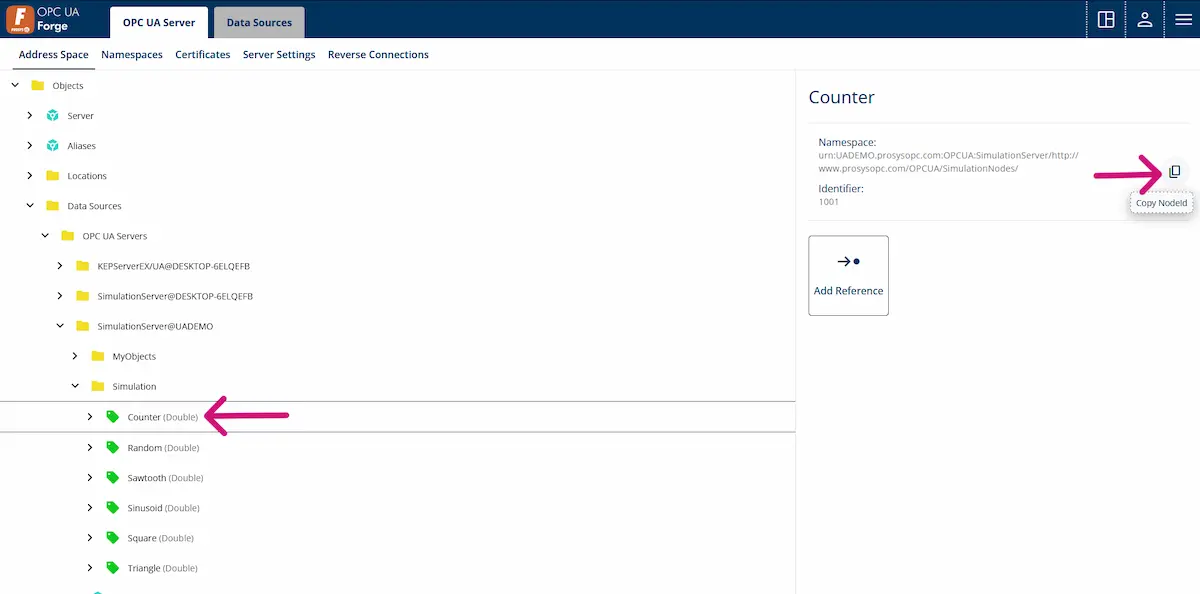
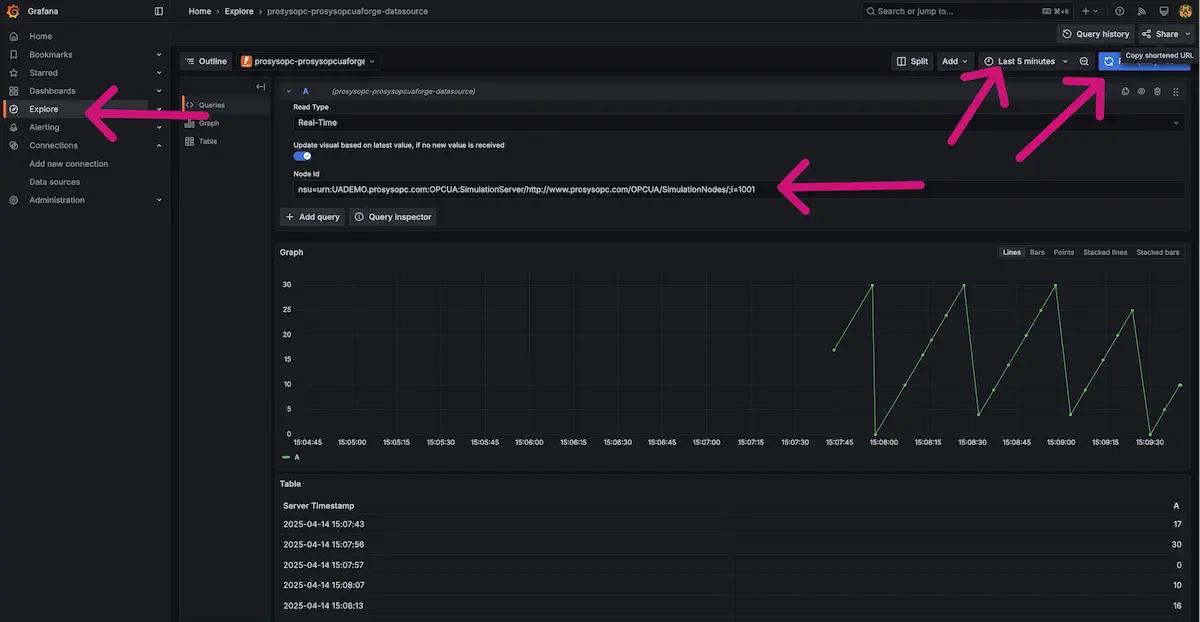
9. Choose the Read Type for your query:
Real-time – Retrieves current values using Forge’s real-time access API, updating the visual according to the refresh interval set in Grafana.
History – Retrieves historical data starting from the most recent value, using the time range selected in the Last 1 hour dropdown.
10. Use the Update visual based on latest value, if no new value is received toggle to control behavior when no new data arrives. If enabled, the graph will continue displaying the most recent known value, even if no update is received.
11. Enter the NodeId in the Node Id field to specify which variable you want to query from Forge. Starting from version 1.3.0, the variable can be browsed from Forge’s address space.
- Read Type: History is only supported for nodes that have OPC UA historical data available.
- You can configure a refresh rate faster than 5 seconds by adjusting the
min_refresh_intervalparameter in the plugin configuration file. - For more details, see the Grafana documentation.
Next Steps
In this tutorial, you learned how to:
- Deploy Grafana with Forge plugin using Docker.
- Add Forge plugin to a running Grafana instance.
- Configure Forge Grafana Plugin to connect Grafana to your Forge instance.
- Prepare the plugin to query and visualize data from OPC UA nodes.
With this setup complete, you can now build Grafana dashboards using data sourced directly from Forge.
For in-depth guidance, check out the Mastering Forge tutorial series. For general information about Forge, visit the product page.
To learn more about Forge and its capabilities, you can request a detailed introduction by emailing sales@prosysopc.com or using our contact form. We’d be happy to provide tailored information about Forge that aligns with your interests and requirements.
Author Info

Iivo Yrjölä
Customer Integration & Support, Prosys OPC
Email: iivo.yrjola@prosysopc.com
