Displaying Sensor Data with Forge's Grafana Plugin
Welcome to our showcase article, where we demonstrate how OPC UA Forge brings real-world data pipelines to life. In this scenario, air-condition sensors stream their measurements as JSON messages to an MQTT broker. Forge consumes this data, harmonizes the structure, and buffers it for visualization, making the information consistent, scalable, and ready for further use. From there, Grafana presents the data on a monitoring dashboard, with the Forge plugin handling the connection details so the integration stays effortless and reliable.
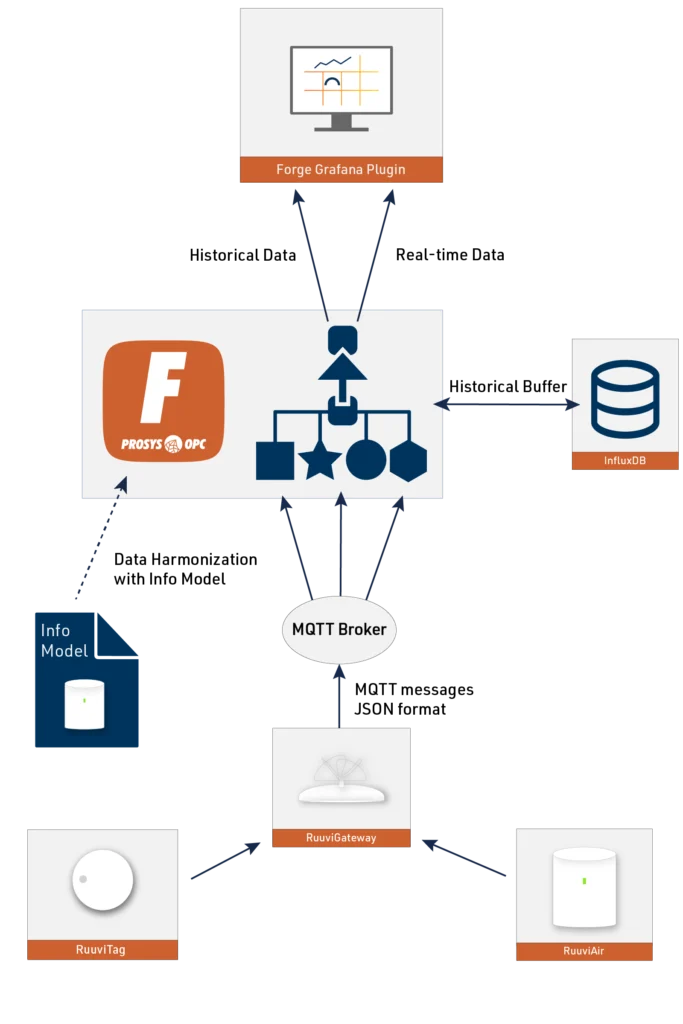
During this tutorial, we’ll be using the following products from Prosys OPC:
- Prosys OPC UA Forge
- You can download an evaluation version through the request form
- You can download an evaluation version through the request form
- Prosys OPC UA Browser
- You can download an evaluation version through the request form
- Prosys OPC UA Forge Grafana Plugin
- You can access the Plugin through Forge’s download page.
1. Sending Ruuvi Sensor Data to MQTT Broker
In this demo, we collect environmental data using RuuviTag Bluetooth sensors and Ruuvi Air air-quality sensors. Both sensor types connect to a RuuviGateway, which forwards their measurements to an MQTT broker as JSON messages. With Prosys OPC UA Browser—or any MQTT client—you can inspect the sensor topics and payloads in real time. The image below shows an example of the JSON data format, with new messages published once per second.

2. Creating Information Model of the System
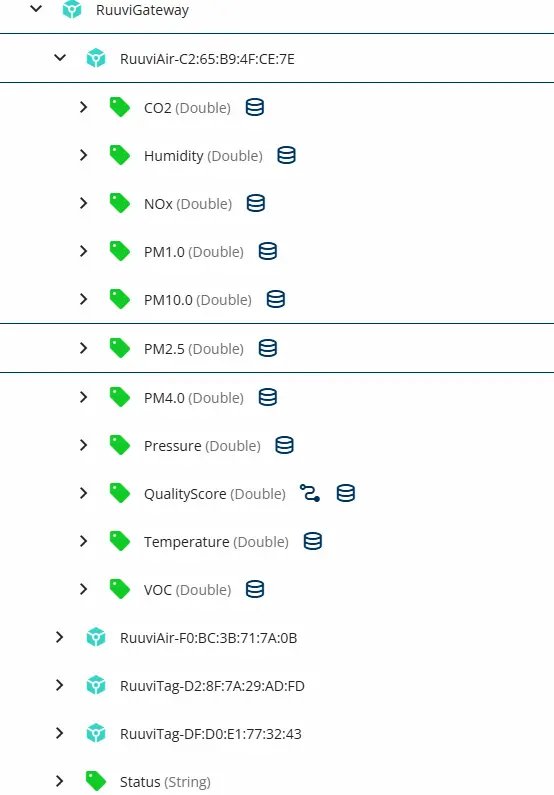
In the next step, we import an information model into Forge’s address space to represent the RuuviGateway, its sensors, and all measurement variables. This creates a structured view of the entire system inside Forge. From there, we can enhance the raw data with additional logic using Forge’s Expressions feature. For example, the QualityScore value in the image below isn’t provided by the sensor itself, but it’s calculated dynamically from multiple measurement variables.
3. Connecting Forge to the MQTT Broker
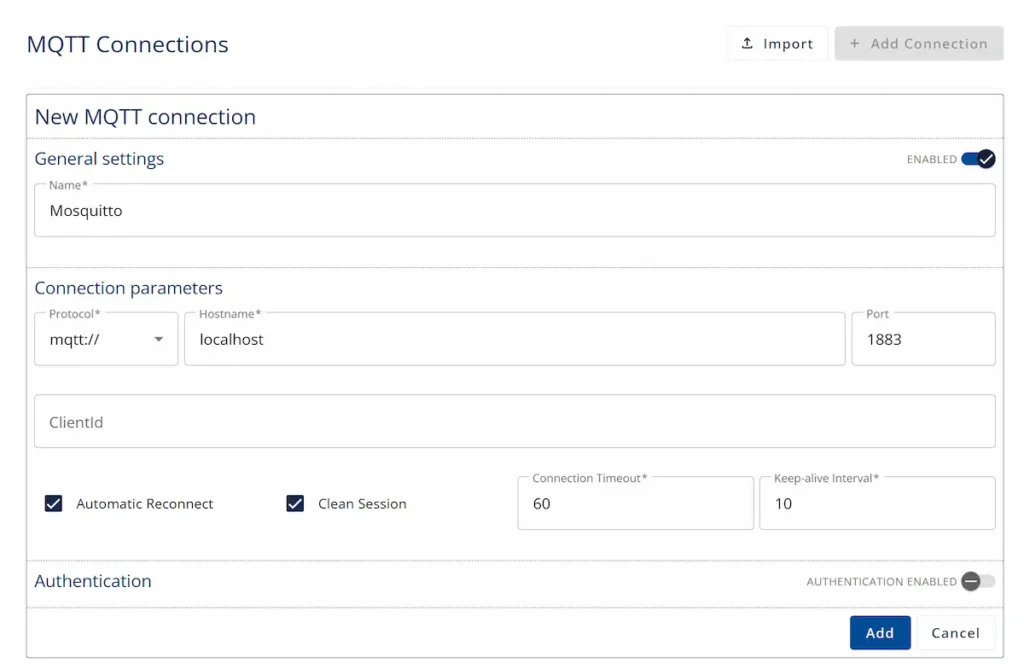
Next, we establish a connection between Forge and the same MQTT broker used by the RuuviGateway to publish its measurements. In this demo, we use a locally running Eclipse Mosquitto broker without any security, but the setup can be secured using authentication or MQTTS when needed. This allows Forge to reliably subscribe to the sensor topics and start processing the incoming data stream.
4. Configuring MQTT Subscriber
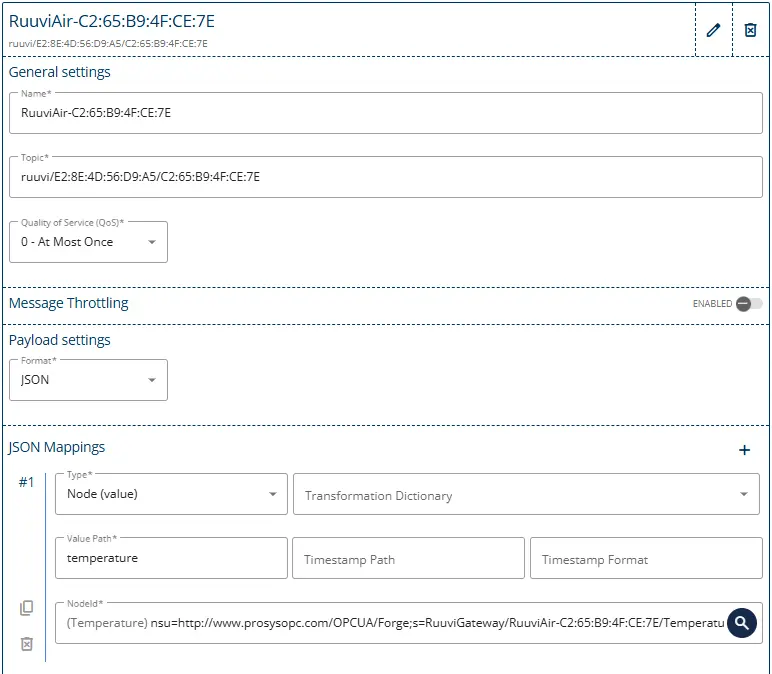
Now we’re ready to set up the data flow from the incoming MQTT messages into the standardized information model. We create MQTT subscribers for the relevant measurement topics and map the parsed values directly to their corresponding OPC UA nodes. This process transforms the raw JSON payloads into structured data, making it easy to scale, visualize, and further process.
5. Grafana Dashboard
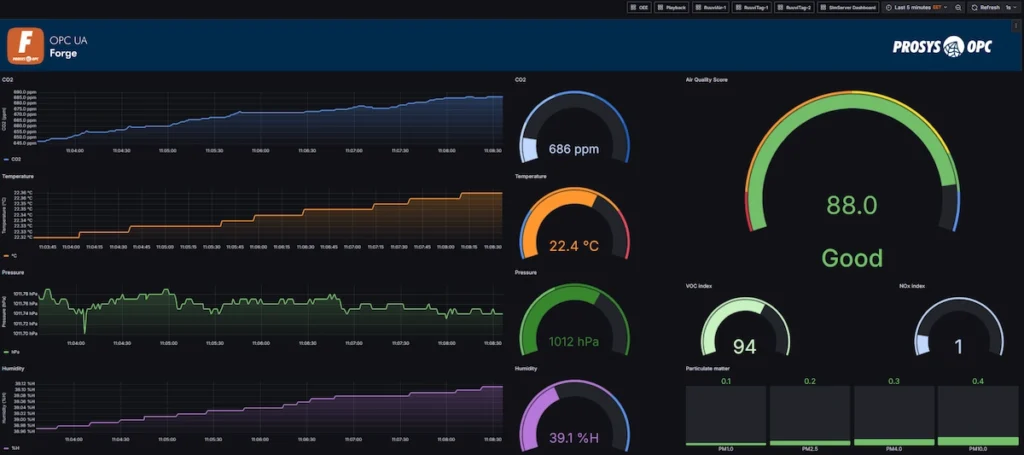
Finally, we configure historical buffering for the measurement data in Forge using the History module. This enables Forge to store past values and serve them efficiently to external applications. With history in place, we set up Grafana to fetch both real-time and historical data from Forge through the Grafana Plugin, making it straightforward to visualize the sensor values in customizable dashboards.
The image below shows a Grafana dashboard displaying the past five minutes of Ruuvi Air data. On the left, you can see CO2 levels, temperature, air pressure, and humidity. On the right, the graphs present the air quality score and related air-quality metrics, all sourced directly from Forge.
6. Summary
In this showcase, we demonstrated how OPC UA Forge can integrate real-world sensor data into a scalable, standardized data pipeline. Starting with RuuviTag and Ruuvi Air sensors publishing JSON measurements to an MQTT broker, we imported a structured information model into Forge and enhanced the raw data using Expressions to create derived values like the QualityScore. Forge then connected to the MQTT broker, subscribed to the sensor topics, and mapped the incoming measurements into OPC UA nodes for harmonized representation.
To support analysis and visualization, we enabled historical buffering through Forge’s History module, allowing both real-time and past data to be accessed efficiently. Finally, Grafana was configured to retrieve this data through the Forge Grafana plugin, resulting in a clear, intuitive dashboard showing live environmental measurements and air-quality indicators. Altogether, the demo illustrates how Forge simplifies data ingestion, modeling, processing, and visualization, providing a robust foundation for scalable industrial data solutions.
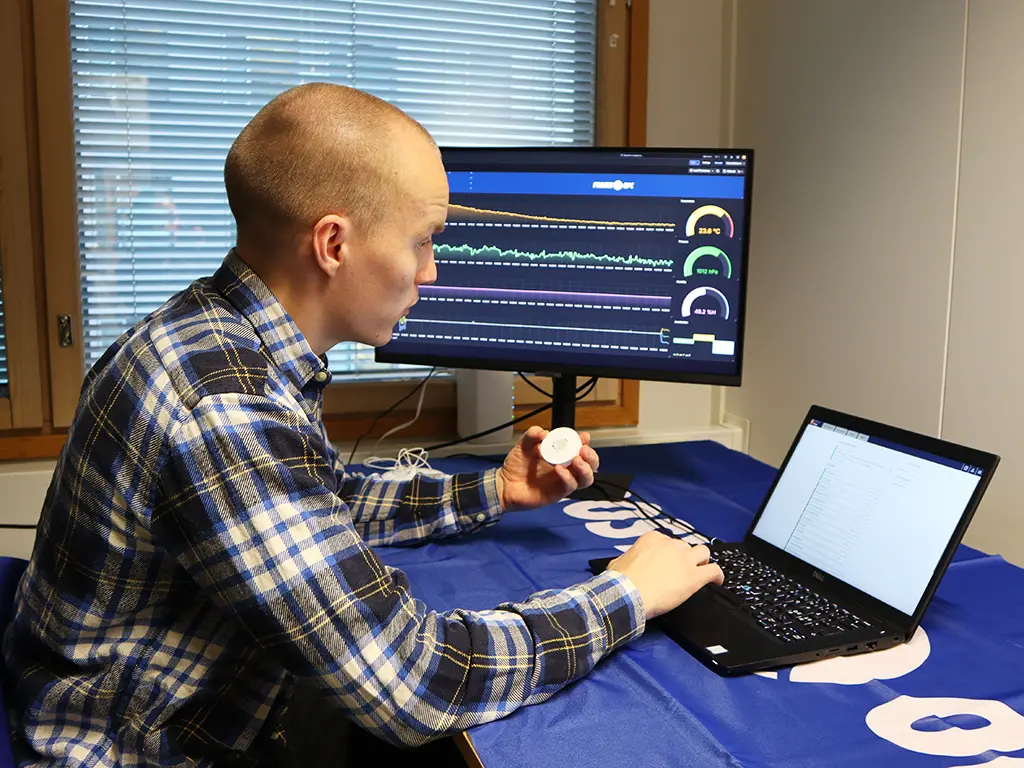
This demonstration was created by Artturi Korhonen, Jere Jaakkola, and Iivo Yrjölä, combining practical engineering experience with OPC UA Forge’s capabilities to build a clear and scalable example of real-world data integration.

Iivo Yrjölä
Customer Integration & Support, Prosys OPC
Email: iivo.yrjola@prosysopc.com
