Dashboards in Prosys Forge: Monitor OT Data in Real Time
3 min read
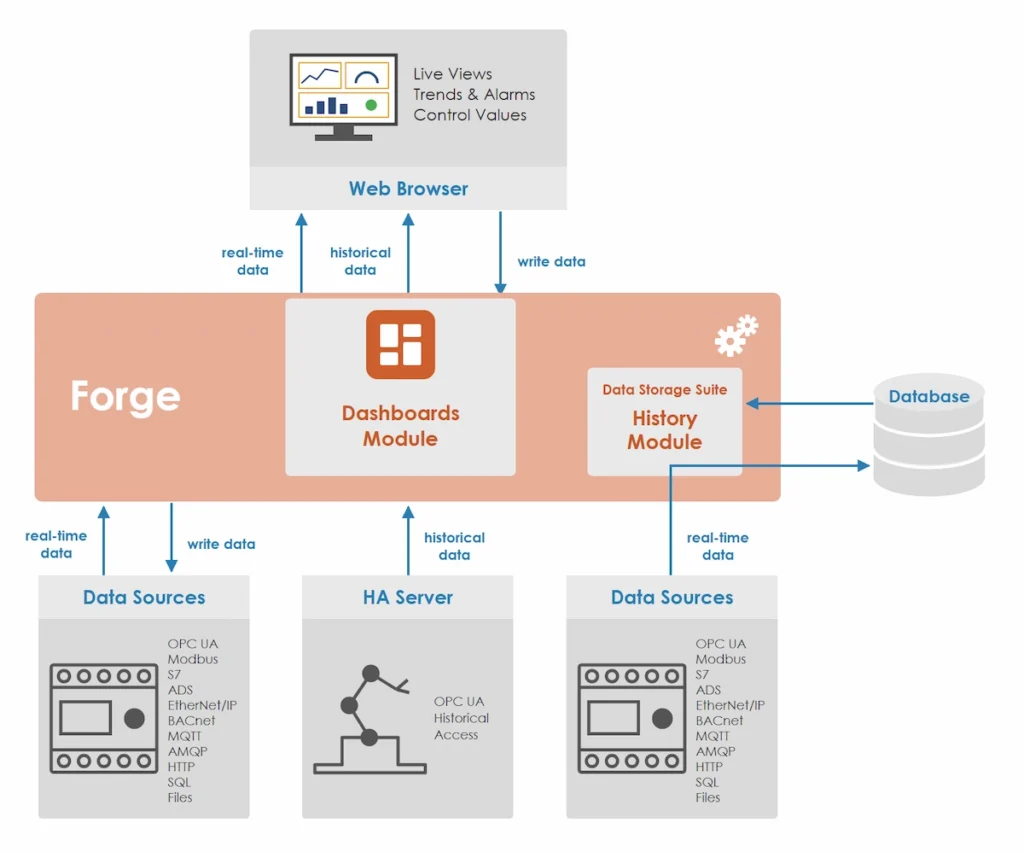
Prosys Forge has established itself as an easy-to-set-up and reliable tool for bringing your OT and IT data behind a single point of access, from OPC UA servers, PLCs and SQL to MQTT, AMQP and HTTP. Until now, visualizing this data has required external software, such as our Forge Grafana Plugin, which remains a valid option that we continue to support. With Forge 2026.2, there is now a second way.
If you prefer to follow along in video format, you can watch the accompanying video.
Dashboards is a new module that lets you build live operational views directly in the Forge web UI. Widgets such as gauges, trend charts, tables, status lights and controls are bound to your aggregated data and update in real time, with no extra software or connections to manage. If your data sources don’t provide OPC UA Historical Access, Forge’s History module can store the data and serve it to your dashboards
Dashboards display data from your data sources such as OPC UA (DA & HA), Modbus, S7COMM, ADS, EtherNet/IP, BACnet, MQTT, AMQP, HTTP, SQL and Files.
These dashboards give operators, engineers and managers a shared, always-current view of what is happening, whether they are checking a production line, commissioning a machine or keeping an eye on a wall display in the control room. In this blog post, we build a dashboard from scratch, from creating it to watching live data update.
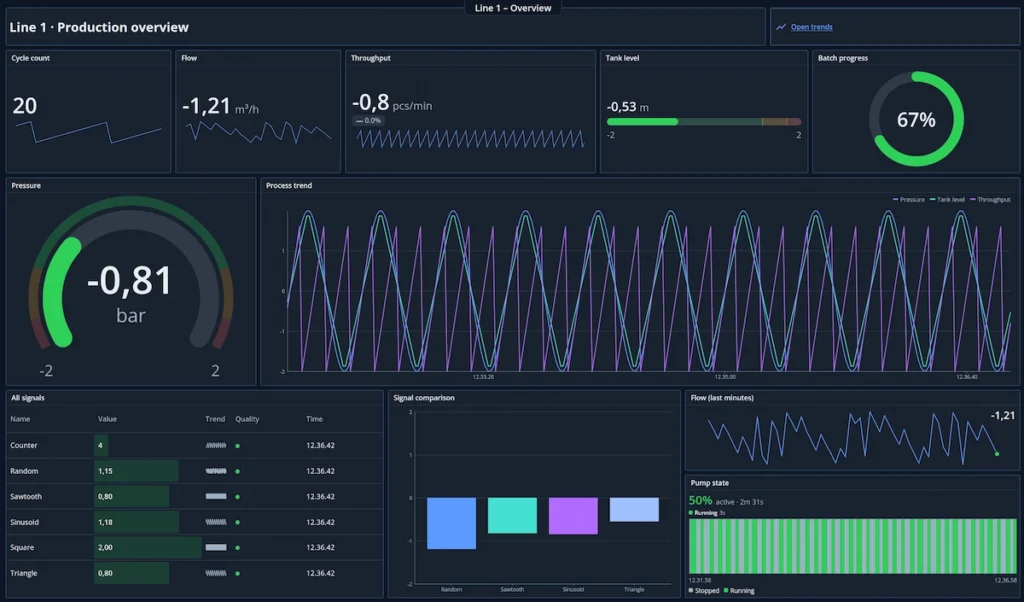
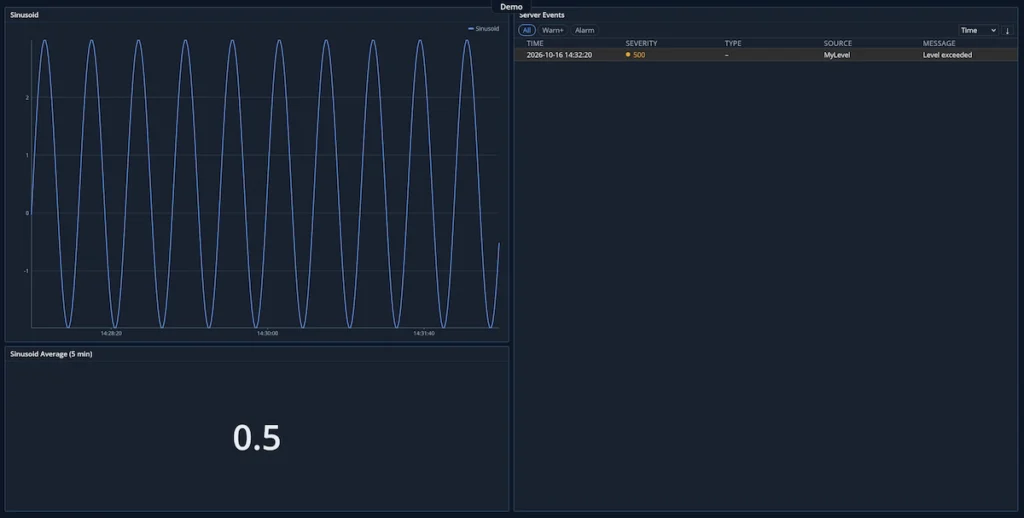
This is how Forge dashboards can look once fully configured.
Creating Dashboards in Forge
Before configuring a dashboard, make sure Forge is connected to a data source with changing values worth visualizing. In this post, we use Prosys OPC UA Simulation Server, which provides simulated real-time and historical data. Alternatively, you can connect Forge to your own servers, PLCs or cloud systems and historize their data with the History module.
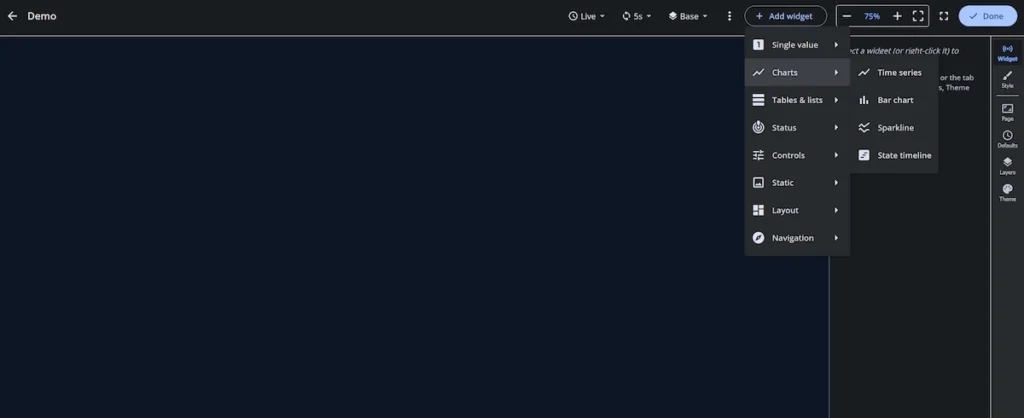
Once the data is ready, we navigate to the Dashboards module and create a new dashboard. In the image below, we have an empty dashboard with the Widget menu open, which offers a wide variety of visualization options to choose from.
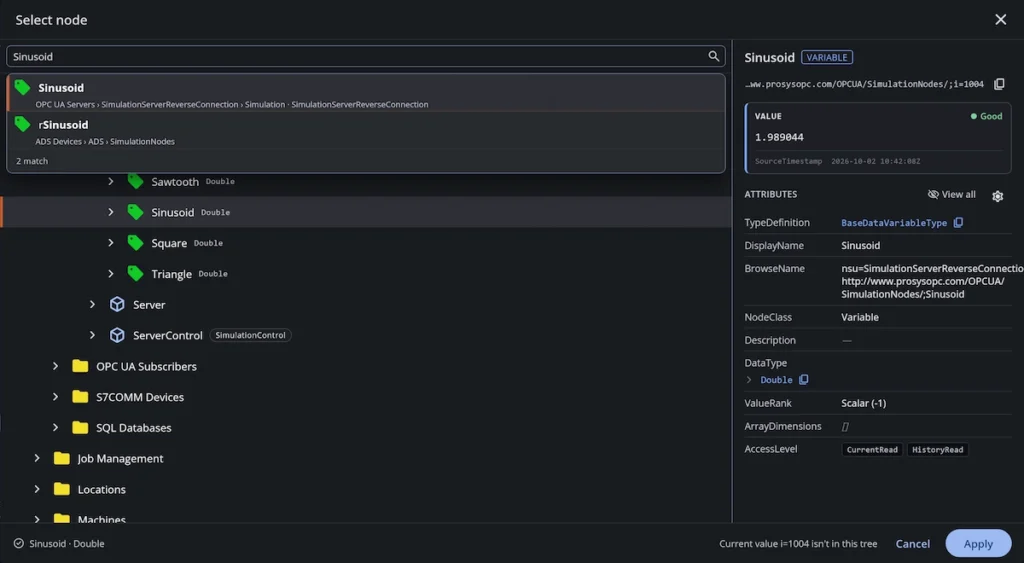
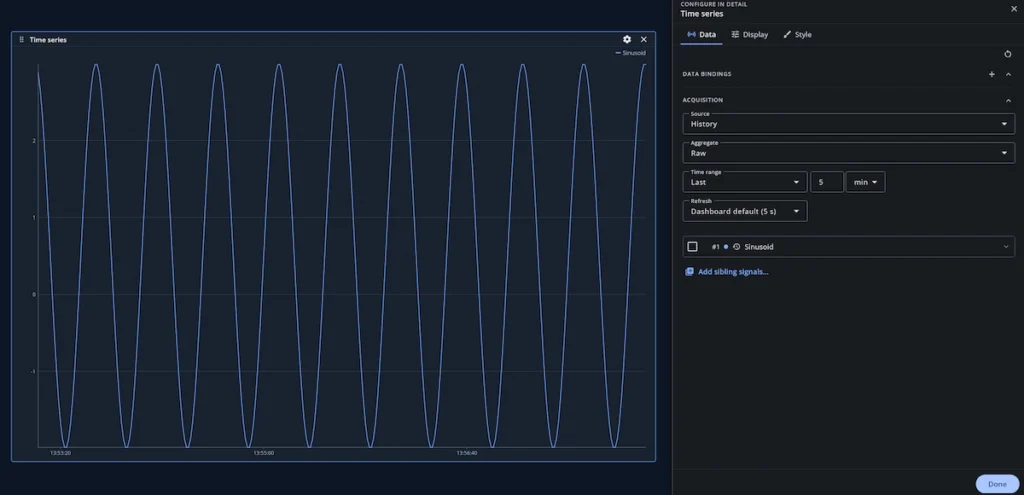
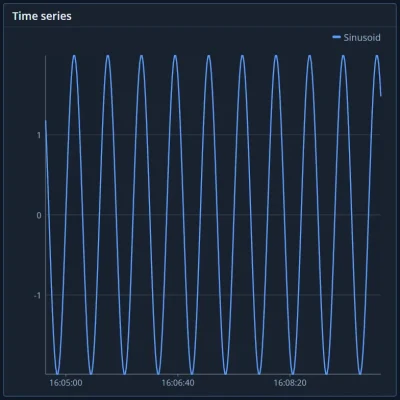
Let’s start with a classic dashboard component, the Time Series widget, which shows historical data over a time range of your choosing. Adding signals to the widgets is done simply by browsing or searching Forge’s address space, which also contains all data from the data sources.
Once the signal (Sinusoid variable) is added, the widget starts drawing it right away. At this point, we can still change settings such as the time range and engineering units, and adjust the widget’s style. If your signal has no history, you can set the Source to Live, and the widget plots incoming values for as long as the dashboard is open.
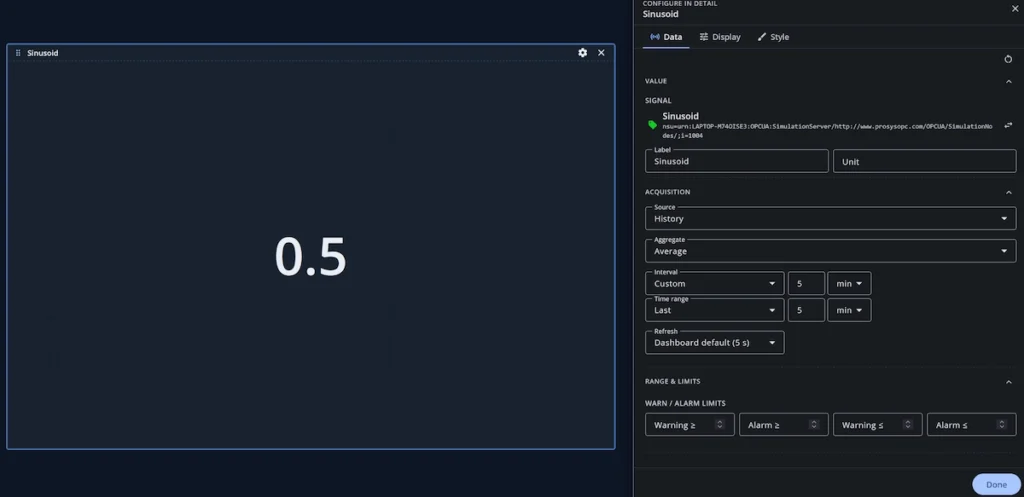
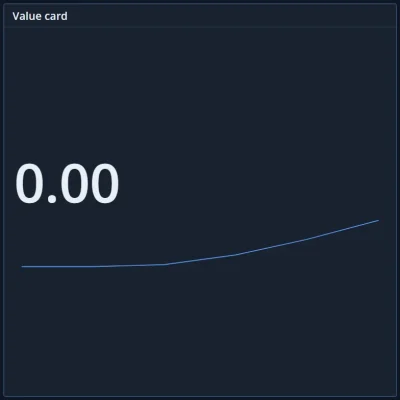
Often, only the most recent value matters. Widgets such as Value Card are ideal for displaying single figures. Another useful case is showing historical aggregates on the dashboard, for example the average energy consumption or the maximum temperature over the past day. In the image below, you can see how easy it is to set up a Value Card that shows the average of the same Sinusoid signal over the last five minutes: we set Aggregate to Average and the interval to five minutes.
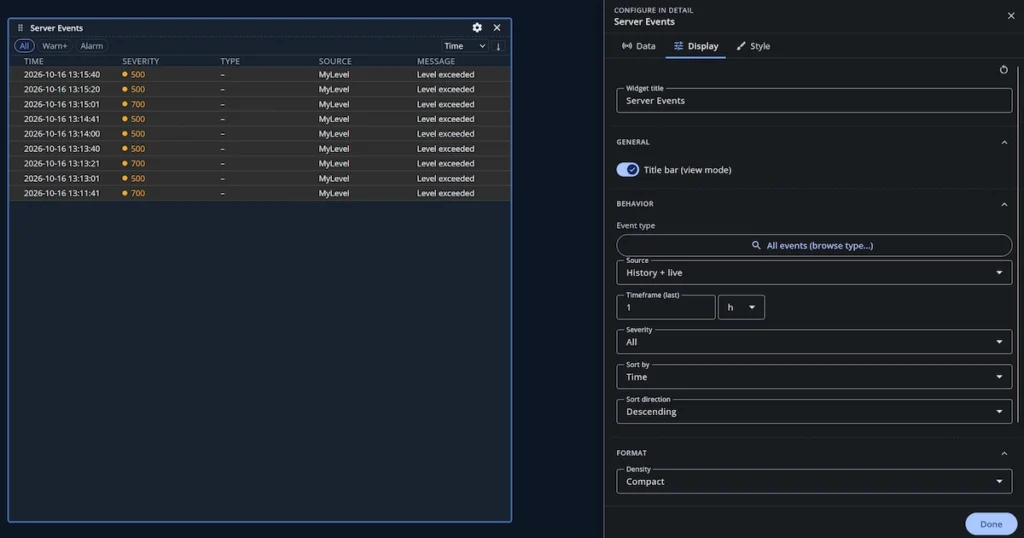
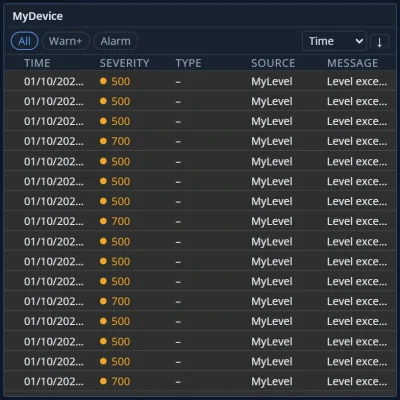
The last widget we use is the Event List. You configure it by selecting a source node that has OPC UA events. A similar widget, Alarm list, shows OPC UA alarms if your server supports them. These widgets are ideal for dashboards that monitor operational changes, warnings, and faults in real time. In the image below, we have configured an Event List widget that monitors Simulation Server’s Server node.
Now that we’ve added the last widget and arranged the layout, our simple dashboard is ready. It brings together a Sinusoid trend over the last few minutes, its five-minute average and a live list of server events, and every widget updates on its own. Save it, and anyone with access to Forge can open the same view.
More Dashboards
Dashboards can be much more than this. Here are two fully configured examples.
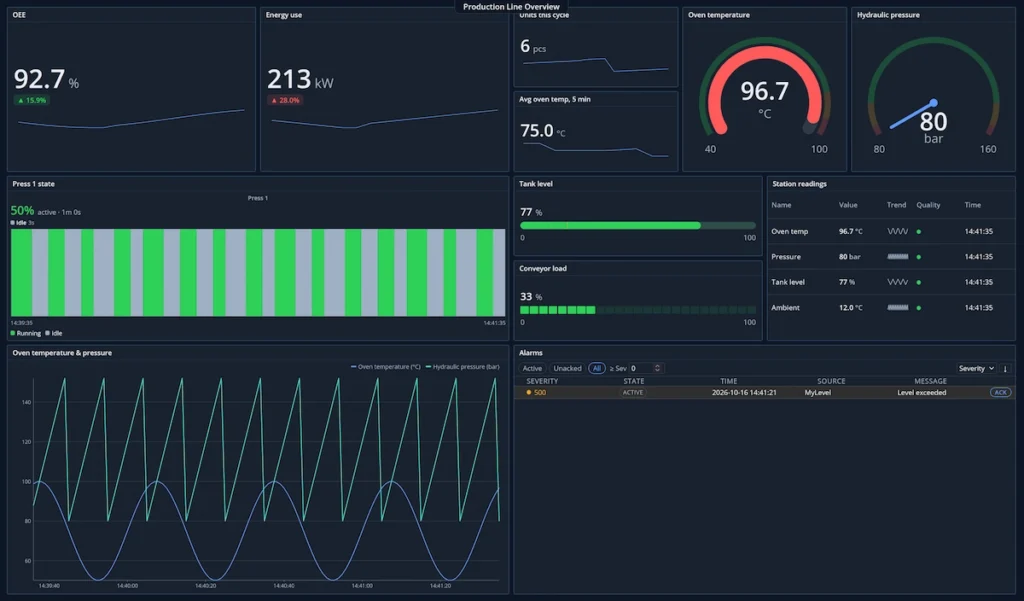
Production Line Overview: A shift supervisor’s view of a whole line: OEE and energy use with their recent changes, live gauges for oven temperature and hydraulic pressure, a state timeline showing when the press was running or idle, and an alarm list for anything that needs attention.
Production Line Overview Dashboard
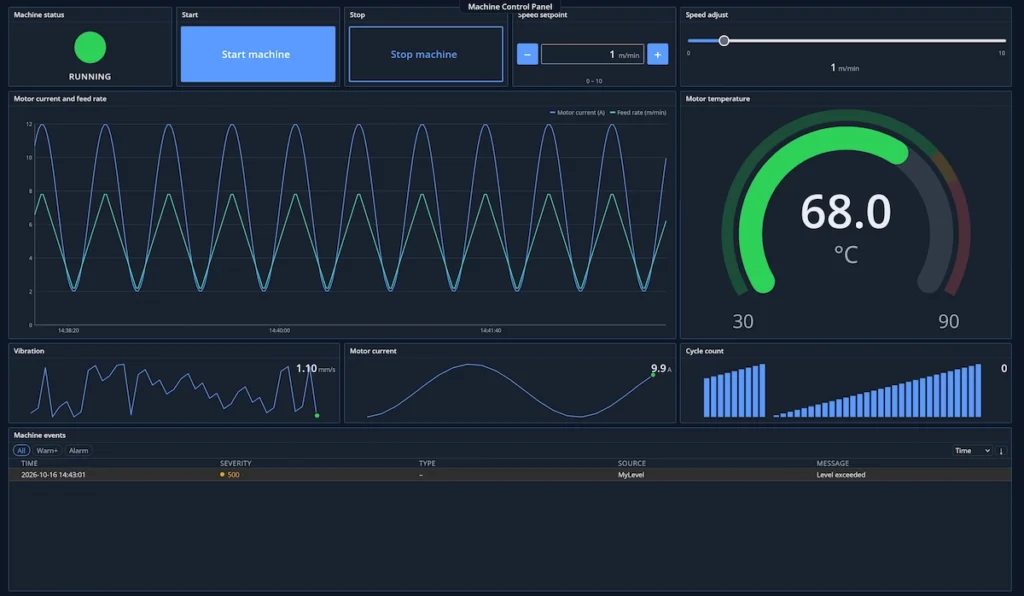
Machine Control Panel: An operator’s panel for a single machine. Besides trends, a gauge and sparklines, it has controls that write back to the machine: start and stop buttons, plus a setpoint and a slider for the speed.
Machine Control Panel Dashboard
Below you can see each type of dashboard widget Forge has to offer by clicking the arrows.
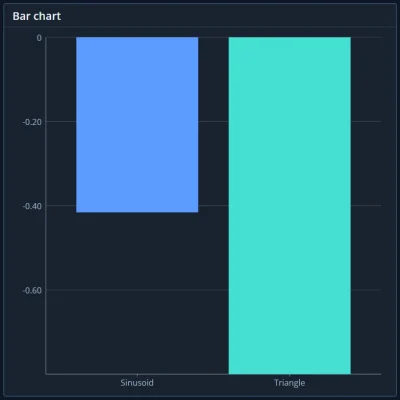
Bar chart: compare values side by side
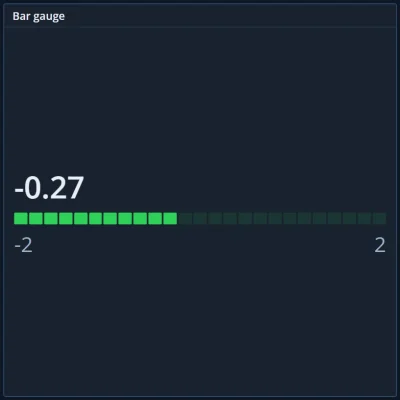
Bar gauge: a bar that fills towards its maximum
Button: write a value with one click
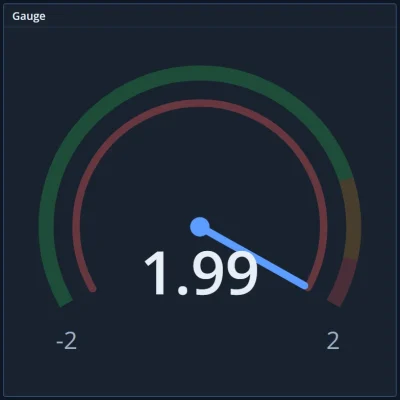
Gauge: a value on a scale with warning and alarm zones
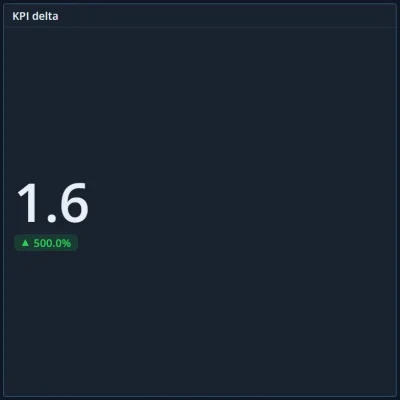
KPI delta: a value and its change against a reference
Method call: call an OPC UA Method
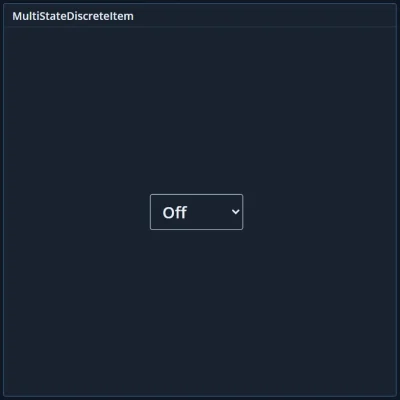
Multi-state: choose a named state to write
Navigation tile: open another dashboard
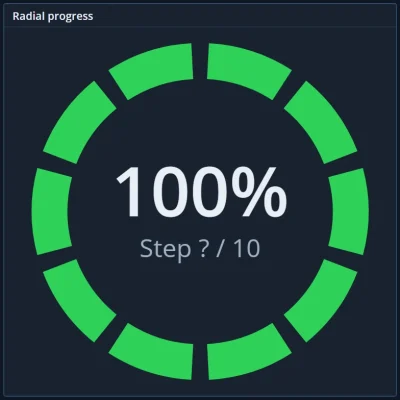
Radial progress: a ring showing progress through a range
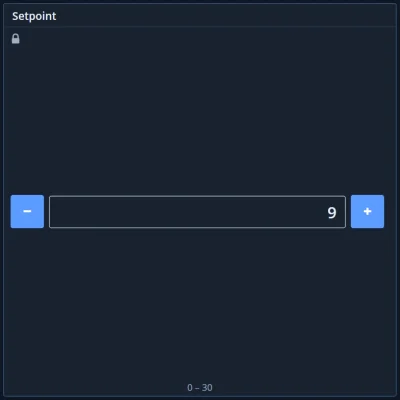
Setpoint: enter and write a target value
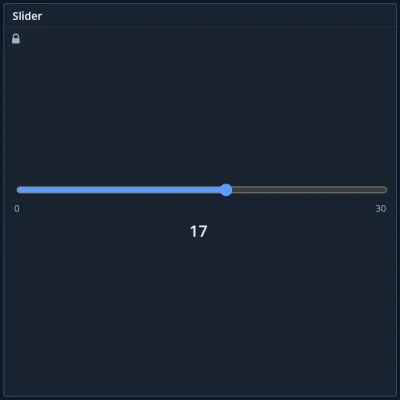
Slider: drag to write a value within a range
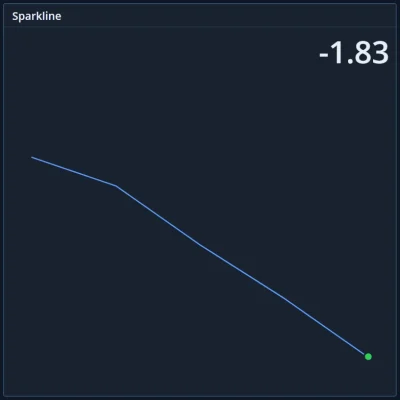
Sparkline: a compact trend for dense layouts
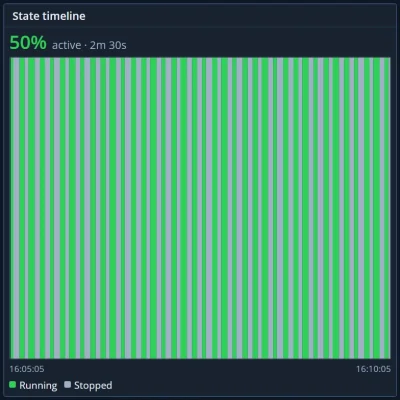
State timeline: when a state changed, and for how long
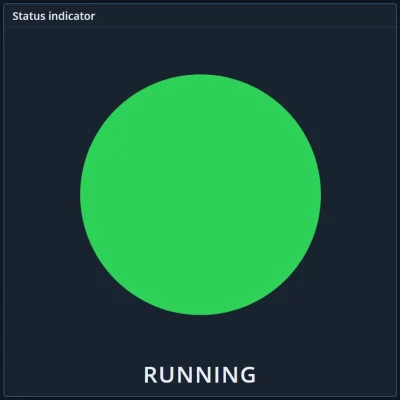
Status indicator: a light for OK and fault
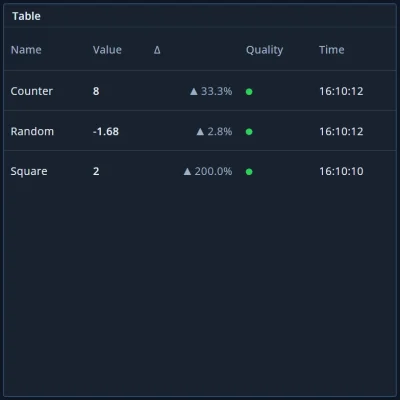
Table: many signals in rows and columns
Time series: history and live values on one chart
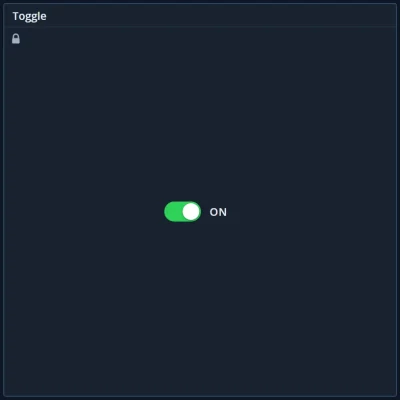
Toggle: switch between two values
Value card: a live value with its label and unit
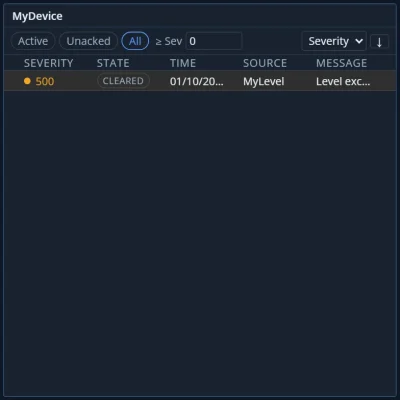
Alarm list: OPC UA alarms with severity and state
Event list: a running log of OPC UA events
Conclusion
With Dashboards, Forge goes from collecting your data to showing it, in the same web UI and on the same connections you have already configured. Live values, history from your servers or from the History module, events, alarms and controls all fit in one view that updates in real time.
Building a large dashboard by hand can take a while. That’s where Forge’s MCP server helps: connect an AI assistant to it, describe the dashboard you want and which data to use, and the assistant browses your address space and builds the dashboard for you. The two example dashboards in this post were created this way, from a single request in plain language.
If you want to learn more about Forge and its capabilities, you can check these Forge resourcesor request a detailed introduction by emailing sales@prosysopc.com or using our contact form. We’d be delighted to provide tailored information about Forge that aligns with your interests and requirements.
Control, secure, and integrate your data with ease.
Forge 2026.2 introduces user interface to import device templates from WoT Thing Description files, which can be quickly instantiated into many devices.
We use cookies to improve your experience. Essential cookies are always enabled.
You can allow additional cookies for analytics and marketing below.
Cookie policy |
Privacy policy.